
Market Rally Amid Middle East Negotiations: A Turning Point...
Global stocks surged as hopes rose for Middle East peace talks, particularly bet...
Updated: 10 Apr 2026
Read →
Global stocks surged as hopes rose for Middle East peace talks, particularly bet...
Updated: 10 Apr 2026
Read →
Global stocks surged as hopes rose for Middle East peace talks, particularly between Israe...
10 Apr, 2026
Read More →
Trilochan Singh Sahney Trust 1 filed regulatory disclosure under SEBI Regulation 31 for sh...
10 Apr, 2026
Read More →
International Business News: Jefferies’ global equity strategist Christopher Wood has said...
10 Apr, 2026
Read More →
March-quarter shareholding disclosures have begun, and so far, around 130 companies have r...
10 Apr, 2026
Read More →
Inflows into equity mutual fund schemes increased 56 per cent in March to Rs 40,450 crore...
10 Apr, 2026
Read More →
The IPO bidding will close on April 13, with shares offered in a price band of Rs 166Rs 17...
10 Apr, 2026
Read More →
Top Commonwealth Sport officials, including Ann Louise Morgan and Neil Carney, visited Ahm...
10 Apr, 2026
Read More →
Equity mutual funds recorded strong inflows of Rs 40,450.26 crore in March — the highest s...
10 Apr, 2026
Read More →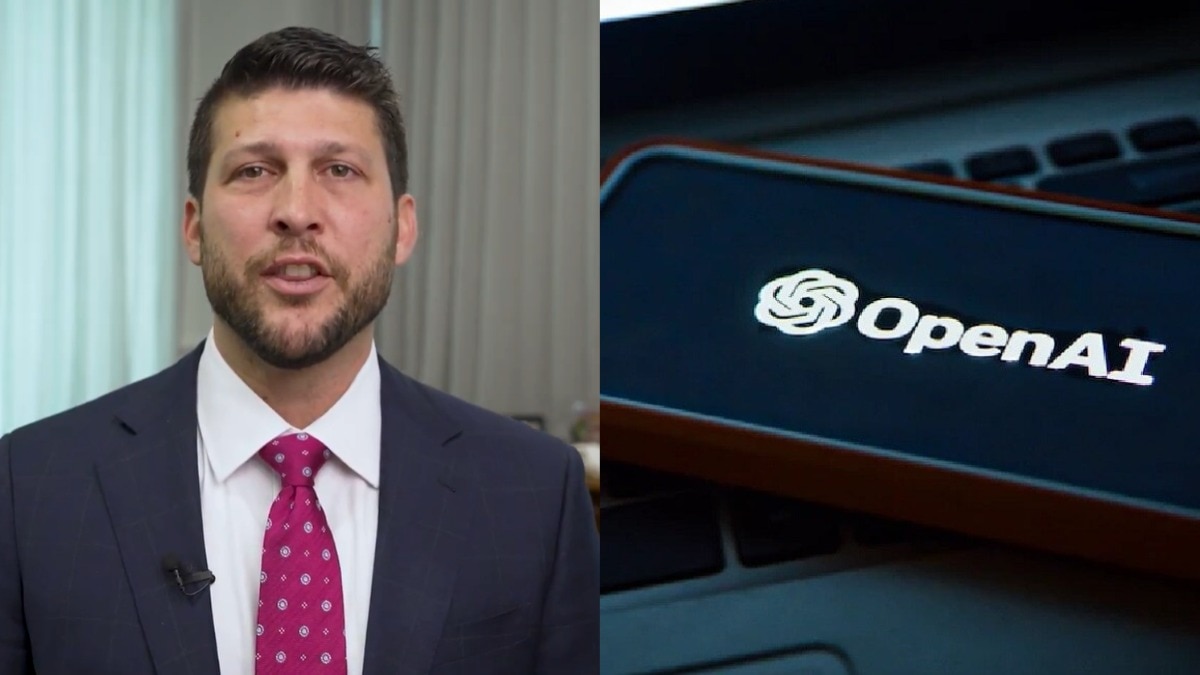
Florida Attorney General raised concerns about OpenAI’s data and AI technology, and links...
10 Apr, 2026
Read More →
Equity MF inflows hit 8-month high in March; SIP inflows hit record at Rs 32,087 crore - M...
10 Apr, 2026
Read More →
Global stocks surged as hopes rose for Middle East peace talks, particularly bet...
Updated: 10 Apr 2026
Read →
Trilochan Singh Sahney Trust 1 filed regulatory disclosure under SEBI Regulation...
Updated: 10 Apr 2026
Read →
March-quarter shareholding disclosures have begun, and so far, around 130 compan...
Updated: 10 Apr 2026
Read →
Inflows into equity mutual fund schemes increased 56 per cent in March to Rs 40,...
Updated: 10 Apr 2026
Read →
The IPO bidding will close on April 13, with shares offered in a price band of R...
Updated: 10 Apr 2026
Read →
Florida Attorney General raised concerns about OpenAI’s data and AI technology,...
Updated: 10 Apr 2026
Read →The IPO of the National Stock Exchange of India is approaching, with eligible sh...
Updated: 10 Apr 2026
Read →
Catalyst Trusteeship Limited disclosed creation of encumbrance on 18,11,47,910 e...
Updated: 10 Apr 2026
Read →
Mutual fund SIP inflows in March hit a record ₹32,087 crore, rising 7.5% as equi...
Updated: 10 Apr 2026
Read →
Gold and silver prices opened slightly lower on Friday on the back of volatile g...
Updated: 10 Apr 2026
Read →