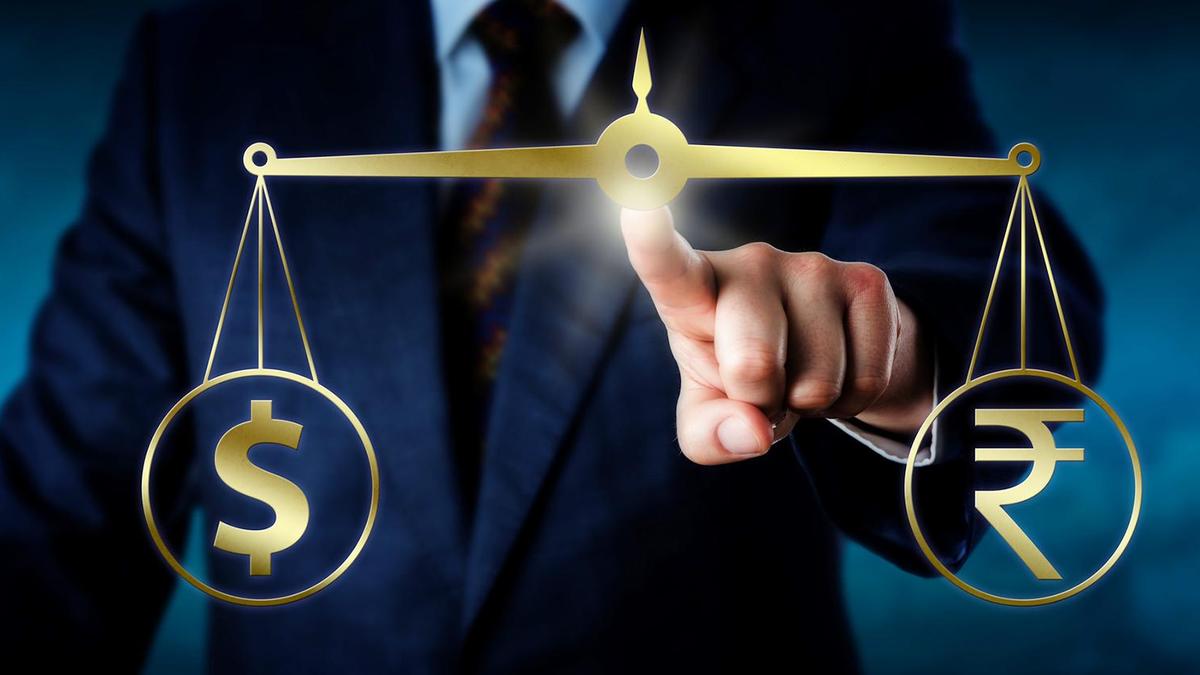
Rupee closes at record low of 95.31 per USD
Source: The Hindu Business Line
11 May 2026


IRM Energy reported its audited standalone and consolidated financial results for the quarter and financial year ended March 31, 2026, as approved by the Board of Directors at its meeting held on May 08, 2026, pursuant to Regulation 33 of the SEBI (Listing Obligations and Disclosure Requirements) Regulations, 2015. The company delivered a sharp improvement in profitability, with standalone profit after tax (PAT) rising 190.46% year-on-year in Q4FY26, driven by strong CNG volume growth and efficient gas sourcing. The board also recommended a final dividend of ₹1.5 per equity share (15% on face value of ₹10 each), subject to shareholder approval at the ensuing Annual General Meeting. Additionally, the board approved the appointment of M/s Dalwadi & Associates, Cost Accountants, as the Cost Auditor for the financial year 2026-27. In continuation of these developments, the audio recording of the post-result earnings conference call held on Saturday, May 09, 2026 at 03:00 p.m. (IST) is now available on the company's website, pursuant to Regulation 30 read with Schedule III of the SEBI (Listing Obligations and Disclosure Requirements) Regulations, 2015.
Q4FY26 & FY26 Standalone Financial Performance
IRM Energy's standalone financials reflect robust growth across revenue and profitability metrics. Revenue from Operations (net of excise duty) stood at Rs. 2,796.72 million in Q4FY26, compared to Rs. 2,678.61 million in Q4FY25, driven by an overall volume increase of approximately 7%. CNG was the primary growth driver, recording 22% year-on-year volume growth in Q4FY26. The table below presents the key standalone profit and loss metrics:
Particulars (₹ Crore): Q4FY26 Q4FY25 YoY (%) Q3FY26 QoQ (%) FY26 FY25 YoY (%) Revenue from Operations: 279.67 267.86 4.41% 265.05 5.52% 1,066.66 975.48 9.35% Total Income: 309.37 297.93 3.84% 295.02 4.87% 1,185.41 1,090.76 8.68% EBITDA (Excl. Other Income): 30.02 17.33 73.17% 29.69 1.10% 112.22 96.33 16.49% EBITDA Margin: 10.73% 6.47% 426 bps 11.20% -47 bps 10.52% 9.88% 65 bps Profit after Tax: 13.22 4.55 190.46% 15.19 -12.98% 56.89 47.05 20.92% PAT Margin: 4.73% 1.70% 303 bps 5.73% -100 bps 5.33% 4.82% 51 bps
On a standalone basis, basic and diluted earnings per share (EPS) for Q4FY26 stood at Rs. 3.22, compared to Rs. 1.11 in Q4FY25. For FY26, standalone EPS was Rs. 13.86 versus Rs. 11.46 in FY25.
Q4FY26 & FY26 Consolidated Financial Performance
The consolidated financials largely mirror the standalone performance, reflecting the company's integrated operations. The table below summarises the consolidated profit and loss highlights:
Particulars (₹ Crore): Q4FY26 Q4FY25 YoY (%) Q3FY26 QoQ (%) FY26 FY25 YoY (%) Revenue from Operations: 279.67 267.86 4.41% 265.05 5.52% 1,066.66 975.48 9.35% Total Income: 309.37 297.92 3.84% 295.02 4.86% 1,185.41 1,090.76 8.68% EBITDA (Excl. Other Income): 30.05 17.33 73.39% 29.63 1.41% 112.25 96.32 16.53% EBITDA Margin: 10.74% 6.47% 427 bps 11.18% -44 bps 10.52% 9.87% 65 bps Profit after Tax*: 12.75 4.39 190.32% 12.83 -0.61% 53.20 45.20 17.70% PAT Margin: 4.56% 1.64% 292 bps 4.84% -28 bps 4.99% 4.63% 35 bps
*After adjustment of share of profit/(loss) of JCE & Associates
Consolidated basic and diluted EPS for Q4FY26 stood at Rs. 3.11, compared to Rs. 1.07 in Q4FY25. For FY26, consolidated EPS was Rs. 12.96 versus Rs. 11.01 in FY25. The consolidated EBITDA for Q4FY26 stood at Rs. 354.12 million, with EBITDA as a percentage of net revenue from operations at 13%.
Segment-Wise Volume Performance
The company's overall sales volume for Q4FY26 was 58.14 mmscm, compared to 57.10 mmscm in Q4FY25 and 56.07 mmscm in Q3FY26. CNG volumes surged to 35.22 mmscm in Q4FY26 from 28.84 mmscm in Q4FY25, marking a 22% year-on-year increase. For the full year FY26, total volume stood at 223.67 mmscm, with CNG contributing 133.53 mmscm. The segment-wise volume breakdown for Q4FY26 is as follows:
Segment: Q4FY26 (mmscm) Q4FY25 (mmscm) Change (%) CNG: 35.22 28.84 22% PNG-I&C: 20.29 23.20 (13%) PNG-D: 2.63 2.40 10% Trading: 0.00 2.66 - Total: 58.14 57.10 2%
During Q4FY26, the company added 2,554 domestic customers, 33 commercial customers, 23 CNG stations, and 2 industrial customers. As of the latest data, IRM Energy caters to 83,262 households, 496 commercial customers, and 223 industrial customers, and operates 150 CNG stations across four operational Geographical Areas spanning six districts.
Debt-Free Balance Sheet and Financial Stability
IRM Energy has continued to strengthen its balance sheet, with total debt declining sharply over three consecutive years. The company's net debt position remains negative, indicating that cash and investments exceed total borrowings. The following table captures the key balance sheet metrics:
Particulars (₹ Crore): FY24 FY25 FY26 Total Debt (Incl. Long Term Lease): 228.30 139.57 72.15 Networth: 931.76 950.72 997.53 Debt-Equity (x): 0.25 0.15 0.07 Cash and Bank Balance: 487.78 345.32 242.55 Investments: 15.35 46.77 33.94 Total Cash and Bank Balance: 503.12 392.09 276.49 Net Debt: -259.48 -205.75 -170.40
On the consolidated balance sheet, total assets stood at Rs. 12,963.10 million as at March 31, 2026, compared to Rs. 12,697.54 million as at March 31, 2025. Total equity attributable to equity holders stood at Rs. 9,975.36 million, while non-current borrowings declined to Rs. 291.77 million from Rs. 519.60 million in the prior year. Net cash generated from operating activities for FY26 was Rs. 1,426.65 million on a consolidated basis.
IPO Proceeds Utilisation
As at March 31, 2026, the company has utilised Rs. 3,014.71 million out of total IPO net proceeds of Rs. 4,957.59 million, with Rs. 1,942.88 million remaining unutilised. The unutilised amount pertains primarily to capital expenditure for the development of the City Gas Distribution network in the Geographical Areas of Namakkal and Tiruchirappalli (Tamil Nadu). The table below provides the utilisation details:
Object as per Prospectus: Amount (₹ Mn) Utilised (₹ Mn) Unutilised (₹ Mn) CGD Network Capex (Namakkal & Tiruchirappalli): 3,072.62 1,129.74 1,942.88 Repayment of Borrowings: 1,350.00 1,350.00 0.00 General Corporate Purposes: 534.97 534.97 0.00 Total: 4,957.59 3,014.71 1,942.88
Key Highlights
Standalone PAT rose 190.46% YoY to ₹13.22 crore in Q4FY26, compared to ₹4.55 crore in Q4FY25
Standalone Revenue from Operations grew 4.41% YoY to ₹279.67 crore in Q4FY26
EBITDA (standalone) expanded 73.17% YoY to ₹30.02 crore in Q4FY26, with margin improving 426 bps to 10.73%
FY26 standalone PAT stood at ₹56.89 crore, up 20.92% YoY
Total debt reduced to ₹72.15 crore in FY26 from ₹228.30 crore in FY24, with a debt-equity ratio of 0.07x
CNG volume grew 22% YoY to 35.22 mmscm in Q4FY26; FY26 CNG volume at 133.53 mmscm
Final dividend of ₹1.5 per equity share recommended by the board
Earnings conference call audio recording for Q4FY26 now available on the company's website
Cost Auditor M/s Dalwadi & Associates appointed for FY2026-27
Statutory Auditors M/s Mukesh M. Shah & Co. issued an unmodified audit opinion on both standalone and consolidated financial results
IRM Energy Limited has filed its investor presentation for the quarter and year ended March 31, 2026, pursuant to Regulation 30 of SEBI (Listing Obligations and Disclosure Requirements) Regulations, 2015. The presentation was submitted to both the National Stock Exchange of India Limited and BSE Limited on May 08, 2026, and was signed by Akshit Soni, Company Secretary and Compliance Officer. The filing follows the company's board meeting held on May 8, 2026, to approve audited financial results for Q4FY26 and FY26, with a post-result earnings conference call scheduled for May 9, 2026, at 3:00 PM IST.
Q4FY26 & FY26 Standalone Financial Performance
IRM Energy delivered a strong standalone performance in Q4FY26, with profit after tax surging 190.46% year-on-year. EBITDA (excluding other income) rose 73.17% YoY, reflecting improved operational efficiency and CNG-driven volume growth. The following table presents the standalone profit and loss highlights:
Particulars (₹ Crore): Q4FY26 Q4FY25 YoY (%) Q3FY26 QoQ (%) FY26 FY25 YoY (%) Revenue from Operations: 279.67 267.86 4.41% 265.05 5.52% 1,066.66 975.48 9.35% Total Income: 309.37 297.93 3.84% 295.02 4.87% 1,185.41 1,090.76 8.68% EBITDA (Excl. Other Income): 30.02 17.33 73.17% 29.69 1.10% 112.22 96.33 16.49% EBITDA Margin: 10.73% 6.47% 426 bps 11.20% -47 bps 10.52% 9.88% 65 bps Profit after Tax: 13.22 4.55 190.46% 15.19 -12.98% 56.89 47.05 20.92% PAT Margin: 4.73% 1.70% 303 bps 5.73% -100 bps 5.33% 4.82% 51 bps
Q4FY26 & FY26 Consolidated Financial Performance
On a consolidated basis, IRM Energy reported a similarly robust performance. Consolidated PAT rose 190.32% YoY in Q4FY26, while EBITDA (excluding other income) expanded 73.39% YoY. The table below summarises the consolidated profit and loss:
Particulars (₹ Crore): Q4FY26 Q4FY25 YoY (%) Q3FY26 QoQ (%) FY26 FY25 YoY (%) Revenue from Operations: 279.67 267.86 4.41% 265.05 5.52% 1,066.66 975.48 9.35% Total Income: 309.37 297.92 3.84% 295.02 4.86% 1,185.41 1,090.76 8.68% EBITDA (Excl. Other Income): 30.05 17.33 73.39% 29.63 1.41% 112.25 96.32 16.53% EBITDA Margin: 10.74% 6.47% 427 bps 11.18% -44 bps 10.52% 9.87% 65 bps Profit after Tax*: 12.75 4.39 190.32% 12.83 -0.61% 53.20 45.20 17.70% PAT Margin: 4.56% 1.64% 292 bps 4.84% -28 bps 4.99% 4.63% 35 bps
*After adjustment of share of profit/(loss) of JCE & Associates
Debt-Free Balance Sheet and Financial Stability
IRM Energy continued to strengthen its balance sheet, significantly reducing debt over the past three years. The company's net debt position remained negative, indicating a cash-surplus status. Key balance sheet metrics are presented below:
Parameter: FY24 FY25 FY26 Total Debt* (₹ crore): 228.30 139.57 72.15 Networth (₹ crore): 931.76 950.72 997.53 Debt-Equity (x)*: 0.25 0.15 0.07 Cash and Bank Balance (₹ crore): 487.78 345.32 242.55 Investments (₹ crore): 15.35 46.77 33.94 Total Cash and Bank Balance (₹ crore): 503.12 392.09 276.49 Net Debt (₹ crore): -259.48 -205.75 -170.40
Operational Highlights and CGD Infrastructure
IRM Energy is a City Gas Distribution (CGD) company with authorised presence across four Geographical Areas (GAs) encompassing six districts in Gujarat, Punjab, Tamil Nadu, and the Union Territory of Diu. CNG was the primary growth driver for the company, with CNG volumes growing 21% YoY for FY26 versus 9% overall volume growth, and 22% YoY in Q4FY26 versus 7% overall volume growth. The company's shareholding pattern as of March 2026 comprised promoter holding of 50.07%, with public and other shareholders accounting for the remaining 49.93%.
Board Meeting and Earnings Call
The board meeting held on May 8, 2026, considered and approved the audited standalone and consolidated financial results for Q4FY26, along with a recommendation on the final dividend on equity shares for FY26, if any. A post-result virtual earnings conference call was scheduled for May 9, 2026, at 3:00 PM IST, attended by the senior management team. Investor relations support for the earnings call is being provided by Ernst & Young LLP. In compliance with insider trading regulations, the trading window for designated persons was closed from April 1, 2026, and is set to reopen 48 hours after the declaration of audited financial results.
We’re building Scanx - to help you express your trading & investing idea, to help you analyse the markets better.
Stock Markets are the true indicator of the growth of any country's economy. We are bullish on India, we are bullish on India's prospects to be one of largest economies of the world. We believe that Stock Markets provide an unique opportunity for all Indians to participate in the growth story of India. We are enabling the same for Indians.
As financial services are becoming more accessible, there is now a large set of Indians today who are financially aware and literate. They value time and seek high quality products & services. Most screening, trading, investing platforms available today are more or less similar to each other, and they have not evolved with time. While both traders & investors have gotten smart about how they make money and build wealth, as users they have continued to use the same products, features, and platforms that were available for years with little or no innovation.
We plan to change that - a technology-led and artificial intelligence enabled platform built for super traders and long term investors.
Disclaimer:
The data and information provided on this website is for general informational and research purposes only. While we strive to ensure that the content is accurate, up-to-date, and reliable, this platform utilizes artificial intelligence (AI) tools to generate, curate, and summarize information. As such, the content may occasionally contain errors, omissions, or outdated information. All users are therefore advised to cross verify the source of the data and information.
This website does not constitute professional, legal, financial, medical, or any other form of licensed advice. Users are encouraged to independently verify any information before relying on it, especially for decisions that may have legal, financial, or personal consequences.
The views, analyses, and summaries presented on this platform may be generated or assisted by AI and do not necessarily reflect the opinions of the website owners, operators, editors, or affiliates.
We make no warranties or representations, express or implied, regarding the completeness, accuracy, reliability, suitability, or availability of the information contained on this website. Any reliance you place on such information is strictly at your own risk.
This website may include links to third-party sources or content. We do not control or endorse the nature, accuracy, or availability of those external sites and are not responsible for any content or damages arising from their use.
By using this website, you acknowledge and agree that the use of AI-generated content involves inherent limitations, uncertainties and inaccuracies, and you accept full responsibility for how you interpret and use the information provided.
We reserve the right to modify, update, or remove content and this disclaimer at any time without prior notice.