
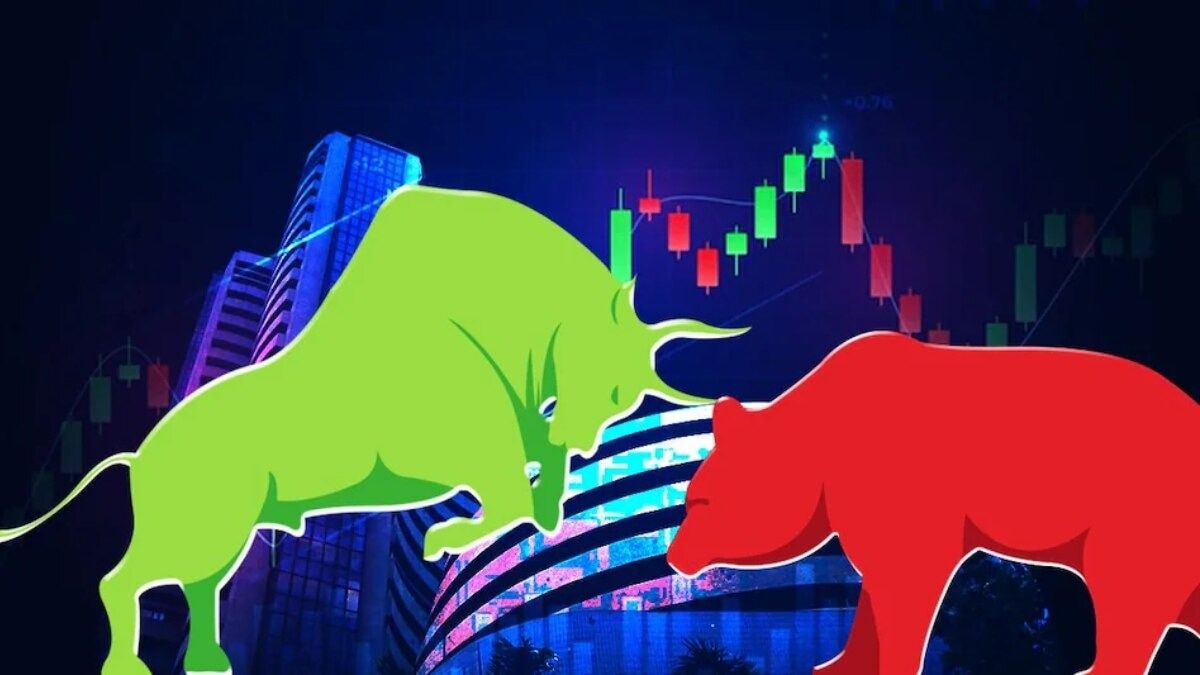
Nifty might have turned negative in Tuesday's trade, it ended a bleak record of failing to surpass its previous day's high for 13 straight sessions. The 50-pack index hit a high of 23,592.85 today, eventually surpassing its prior session's high of 23,448.10, ending the streak.
ICICIdirect in a note suggested that this unusual pattern had occurred only 34 times over the past three decades. Effectively, on 25 of those 34 occasions, the market delivered positive returns over the subsequent three to six months, with an average of double-digit gains.
On each such occasion, Nifty followed two more criteria’s which validated bottoming out process.
ICICIdirect said Nifty is trading well below its 200-day EMA. Historically, such decline below long-term average present attractive risk-reward setups. Besides, the weekly Stochastic oscillator has plunged deep into oversold territory (placed at 17), indicating that downside momentum is stretched and inclined for potential pullback rally.
ICICIdirect believes the current corrective leg appears is entering its final exhaustion phase, supported by a couple of statistical signals.
"Structurally, for the past five months, market activity has been squeezed inside the range set in March (22,284 – 24,989). Such extended multi-month volatility contractions are rare and typically pave the foundation for a directional move," ICICIdirect said.
The domestic brokerage said supportive efforts emerged from the price parity of the April–June decline (1,530 points) after a 1,500-point decline over five weeks.
As long as the Nifty hold Friday’s panic low 23,200 level, the door remains open for a technical mean-reversion move back toward the 24,000 psychological mark, ICICIdirect said.
"Only a decisive close below 23,200 would result in extension of decline towards 22,700 being placement of 80 per cent retracement of Apr-Aug rally (22,182-24,774) coincided with upward sloping trend line (adjoining Jun-24 and Apr-25)," ICICIdirect said.
Meanwhile, Nifty midcap and small cap indices retested 20-month consolidation breakout and as per ICICIdirect the key point to highlight is that the ratio chart of Smallcap / Nifty is now breaking out from its 18-year downward sloping trend line, indicating this is just a start of the secular uptrend in smallcaps.
"The sharp up move (10 per cent) in Crude oil pulled it near 6 months falling trend line ($106). The lack of follow-through strength above last week’s high ($110) would result in a pullback rally in Nifty," it said.