Best stocks to buy: Discover MarketSmith India's recommended stocks for 22 July. Get insights into top-performing stocks and make informed investment decisions.
Best stock recommendations today: MarketSmith India's top picks for 22 July
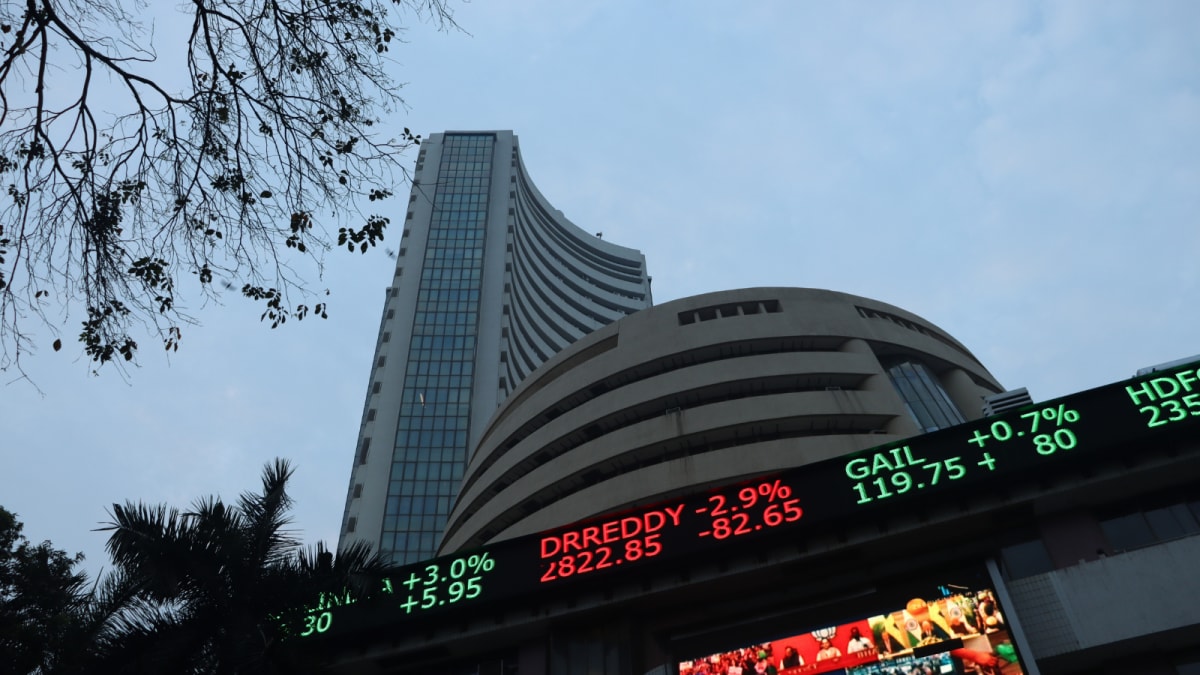
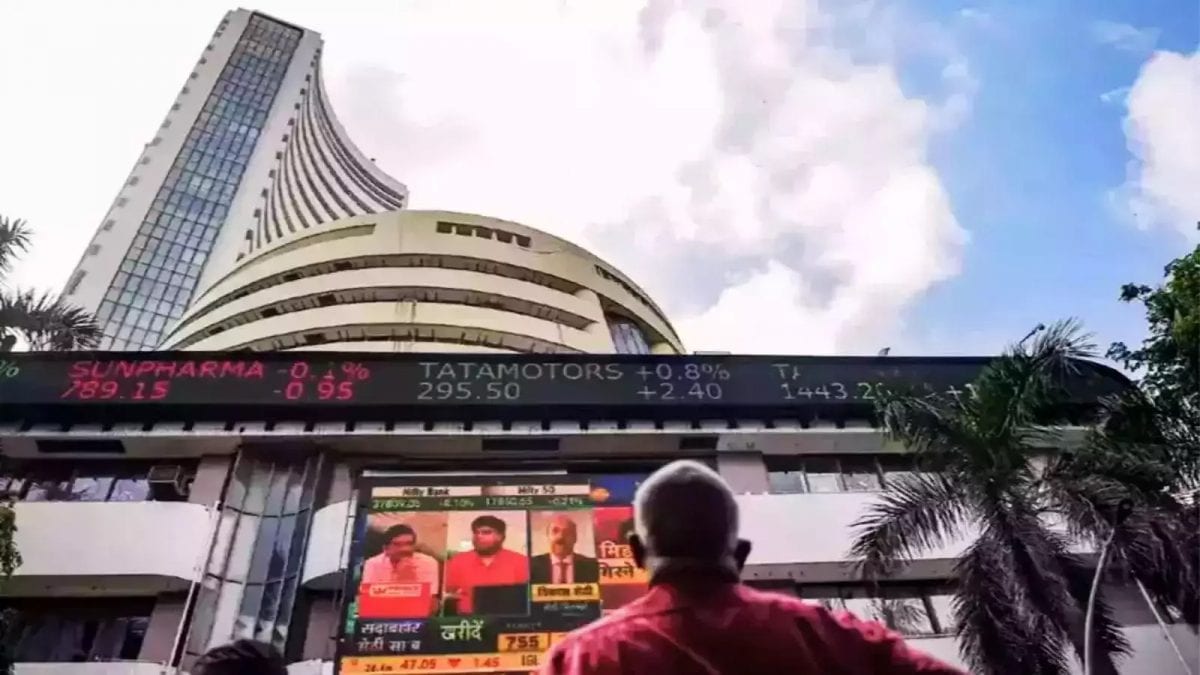
On 21 July, Indian equity benchmarks ended on a strong note with the Nifty closing at 25,090.70, up 122.30 points or 0.49%. The index snapped a two-day losing streak and reclaimed 25,000 in a volatile session, supported by strength in auto, realty, metal , and private banking stocks.
Despite slipping below 24,900 for the first time since 23 June during early trade, the index staged a smart recovery and ended near the day’s high, reflecting renewed investor confidence.
Two stock recommendations for today by MarketSmith India
Dixon Technologies (India) Limited(current price: ₹ 16,281)
Why it’s recommended: Growth and strategic expansion, strong structural advantages
Key metrics: P/E: 118.49, 52-week high: ₹ 19,148.90, volume: ₹ 846.02 crore
19,148.90, volume: 846.02 crore Technical analysis: Cup-with-handle pattern breakout on above average volume
Risk factors: Client concentration and demand volatility, thin margins and PLI reliance, execution risk and backward integration, supply chain and tech risk
Buy: ₹ 16,281
16,281 Target price: ₹ 18,900 in two to three months
18,900 in two to three months Stop loss: ₹ 15,300
Also Read | Margin pain hits HDFC Bank and ICICI Bank, but one of them has a bigger buffer
L&T Finance Limited (current price: ₹ 210)
Why it’s recommended: Diversified lending portfolio, shift toward retail focus, robust asset quality, and collection efficiency
Key metrics: P/E: 19.08, 52-week high: ₹ 213, volume: ₹ 594.83 crore
213, volume: 594.83 crore Technical analysis: 21-DMA bounce
Risk factors: Exposure to rural and semi-urban markets, competitive pressure
Buy at: ₹ 210
210 Target price: ₹ 238 in two to three months
238 in two to three months Stop loss: ₹ 198
How Nifty 50 performed on 21 July
Nifty 50 rebounded on 21 July, gaining 0.49% after a two-day decline and successfully defending the key support level of 24,900, which aligns with its 50-day EMA.
After early volatility, the index gained momentum and maintained a positive bias throughout the day, ending 122 points higher at 25,091. On the daily chart, it formed a bullish candle with a lower shadow, signaling a pullback after briefly breaching the 25,000 support level in the previous session.
The initial reaction to earnings from heavyweights such as Reliance, ICICI Bank, and HDFC Bank triggered sharp intraday swings. However, renewed buying in key index constituents during the final hours lifted Nifty 50 to near the session’s high at 25,090.70.
The index reclaimed both its 50-DMA and the key psychological level of 25,000, signaling a potential shift in sentiment. The intraday reversal pattern, along with the formation of a bullish candle near the 50-day SMA, suggests that the ongoing pullback may continue in the near term.
Also Read | JSW Steel gets back its lustre in Q1; safeguard duty provides support
On the daily chart, the relative strength index (RSI) has turned upward and is approaching 48, showing signs of a reversal. However, the daily MACD remains in a downtrend with a negative crossover above the zero line, showing that bearish undertones persist.
According to O'Neil’s methodology of market direction, the market status has been downgraded to an 'uptrend under pressure' as Nifty breached its 50-DMA and the distribution day count rose to five.
The index managed to reclaim its 50-DMA in the final hour, offering some relief to investors. However, to regain bullish momentum, a decisive breakout and sustained close above 25,300 are crucial. On the downside, if the index fails to hold above 24,900, it could decline further toward the 24,750 and 24,500 support levels in the coming sessions.
How did Nifty Bank perform?
Nifty Bank opened on a positive note and maintained its strength for most of the session, snapping its two-day losing streak. The index rebounded from its 50-DMA and reclaimed the 21-DMA, reflecting a positive bias. Notably, it formed a bullish candlestick on the daily chart, characterised by a higher-high and higher-low price structure, indicating renewed buying interest.
The momentum indicator, RSI, has edged higher and now stands at 54, signaling a mild improvement in underlying strength. Meanwhile, the MACD has recorded a negative crossover yet continues to trade above the zero line, suggesting that while the broader trend remains constructive, investors may consider exercising caution and awaiting stronger confirmation before anticipating a sustained bullish move.
According to O’Neil’s methodology of market direction, Bank Nifty remains in a 'confirmed uptrend', a status it has maintained over the past few weeks.
Nifty Bank has rebounded from its 50-DMA and reclaimed the 21-DMA, signaling a potential shift in momentum. Should this positive breakout continue, the index may gradually advance toward its recent high of 57,628 in the coming sessions. On the downside, 56,600–56,500 serves as a crucial support area, expected to cushion near-term declines. Close monitoring of these technical levels remains essential for effective risk management and tactical positioning.
Also Read | RIL eyes next big catalyst for new energy business
MarketSmith India is a stock research platform and advisory service focused on the Indian stock market. It offers tools and resources to help investors make informed decisions based on the CAN SLIM methodology, founded by legendary investor William J. O'Neil. You can access a 10-day free trial by registering on its website.
Trade name: William O’Neil India Pvt. Ltd.
Sebi Registration No.: INH000015543
Disclaimer: The views and recommendations given in this article are those of individual analysts. These do not represent the views of Mint. We advise investors to check with certified experts before making any investment decisions.